Getting started with the Arduino IDE 2.0 debugger
Intro
I believe Arduino's software development IDE has been one of the biggest reasons for their success. Combined with their core API that "just works" across multiple MCU architectures, these two elements have made embedded software development accessible to everyone. If you've ever ventured outside of the Arduino 'bubble' and tried to do embedded software development on other vendor's IDEs, then you know what I mean. They routinely involve complex setup procedures, poor documentation, custom APIs, external interface hardware, and sometimes even licensing fees. For my work, one of the most valuable features of the Arduino system is the homogeneity of working with different target processors. I use a wide selection of boards and switching between radically different MCUs usually just involves selecting the target and recompiling.
One thing that was missing from the Arduino IDE was the ability to do 'live debugging' of embedded boards. On our PCs we are used to the idea of being able to set breakpoints in our code and examine variables and memory while the program is running. Debugging embedded software is a bit more challenging and has historically involved using in-circuit emulators or JTAG debug equipment. Many of todays embedded CPUs offer a hardware debug interface that allows for single-step debugging and examination of registers and memory. The common name for this is Serial-Wire-Debug or SWD. The SWD interface consists of a clock and data line along with GND, Vcc ref and reset. The SWD capabilities include not only debug, but erasing and rewriting of the entire flash memory. This is how the bootloader code is flashed into most of today's Arm Cortex-M MCUs. Various software exists for debugging embedded projects through the SWD interface; what's new is its inclusion in the Arduino IDE 2.0 beta.
Setup
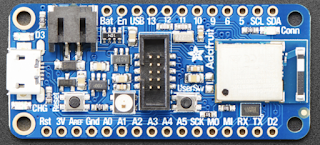
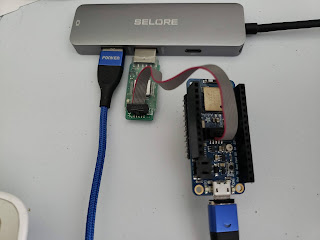
SWD debugging is an area I don't have much experience in, so if any of this information is incorrect, please let me know. I wanted to get started with the 2.0 beta IDE without too much effort. I have a Segger j-link mini and plenty of dev boards to try it on. One problem is that most Arduino boards don't expose the SWD signals in a convenient way - they're often tiny test points on the bottom of the board (the 5 pins on the left):
After pressing the run button, the output window should show that the j-link succeeded and that the code has been downloaded to your device. Now you need to open the Debug Console window by pressing the top-right button in the icon area shown above (white rectangle with tiny > in it). In the Debug Console you'll see this:
I'm not sure about the error, but you'll see a blinking cursor waiting for you to type something. This is the familiar GDB command line. Normally you would type 'r' to run your program, but doing that seems to run the bootloader code. To execute your sketch, type 'start' followed by the ENTER key. This will initialize your sketch and you'll see main.cpp open in the editor with the highlight on the first line of of the main() function. For those unfamiliar with this in Arduino, if you don't write your own main() function, then Arduino provides one which first calls setup() and then calls loop() over and over. Now you can set breakpoints in your sketch and start debugging like you're used to doing. Hit the play/pause or step buttons to continue execution of your code.
I hope this was helpful in getting you started with live/hardware debugging using the new Arduino IDE 2.0 beta. I'll update this article as more info becomes available.


Too bad you still need the board to try debugging. I was hoping to get my code up and running before I started putting together the system
ReplyDeleteAny idea how to configure the json file to debug an esp32 with esp-prog debugger? This works quite well in platformIO, it would be a nice improvement if it worked in Arduino IDE 2.0 as well.
ReplyDeleteSorry, I don't know.
DeleteAny plans to update this tutorial for RP2040? The Arduino version or RPi version. There's also the Adafruit feather version too. Lots of versions.
ReplyDelete