The "CO2" Project
The "CO2" Project
By Larry Bank
Environmental sensing and air quality have always been fascinating to study. I've tested various sensors over the years that, until recently, cost next to nothing. The COVID pandemic increased my curiosity (and concern) about indoor air quality, CO2 levels, and shared air. In the past, I tried to save some money and use the "eCO2" value from several inexpensive sensors, but the results were unreliable and unsatisfying. eCO2 is an "equivalent CO2" value generated by some VOC (volatile organic compound) sensors. The idea is that human breath contains lots of VOCs and if you detect them, you're also detecting CO2. The flaw in this thinking is that a lot of other things generate VOCs and have nothing to do with CO2. A good example of a false positive is food preparation. Bring your VOC sensor into the kitchen when you're cooking and it will tell you that the air has a toxic level of "eCO2". I've been wanting to experiment with true CO2 sensors, but the cost has kept me from following through because I didn't have a real project in mind. I finally took the plunge with a true CO2 sensor because Sensiron recently launched a small, low power one that looked like a worthwhile acquisition - the SCD41. This sensor is a cube of roughly 8mm on a side that reports an accurate CO2 measurement using an IR light scattering method.
My initial results
I used a solderless breadboard to run the sensor in my bedroom with the output displayed on one of my ubiquitous SSD1306 OLEDs.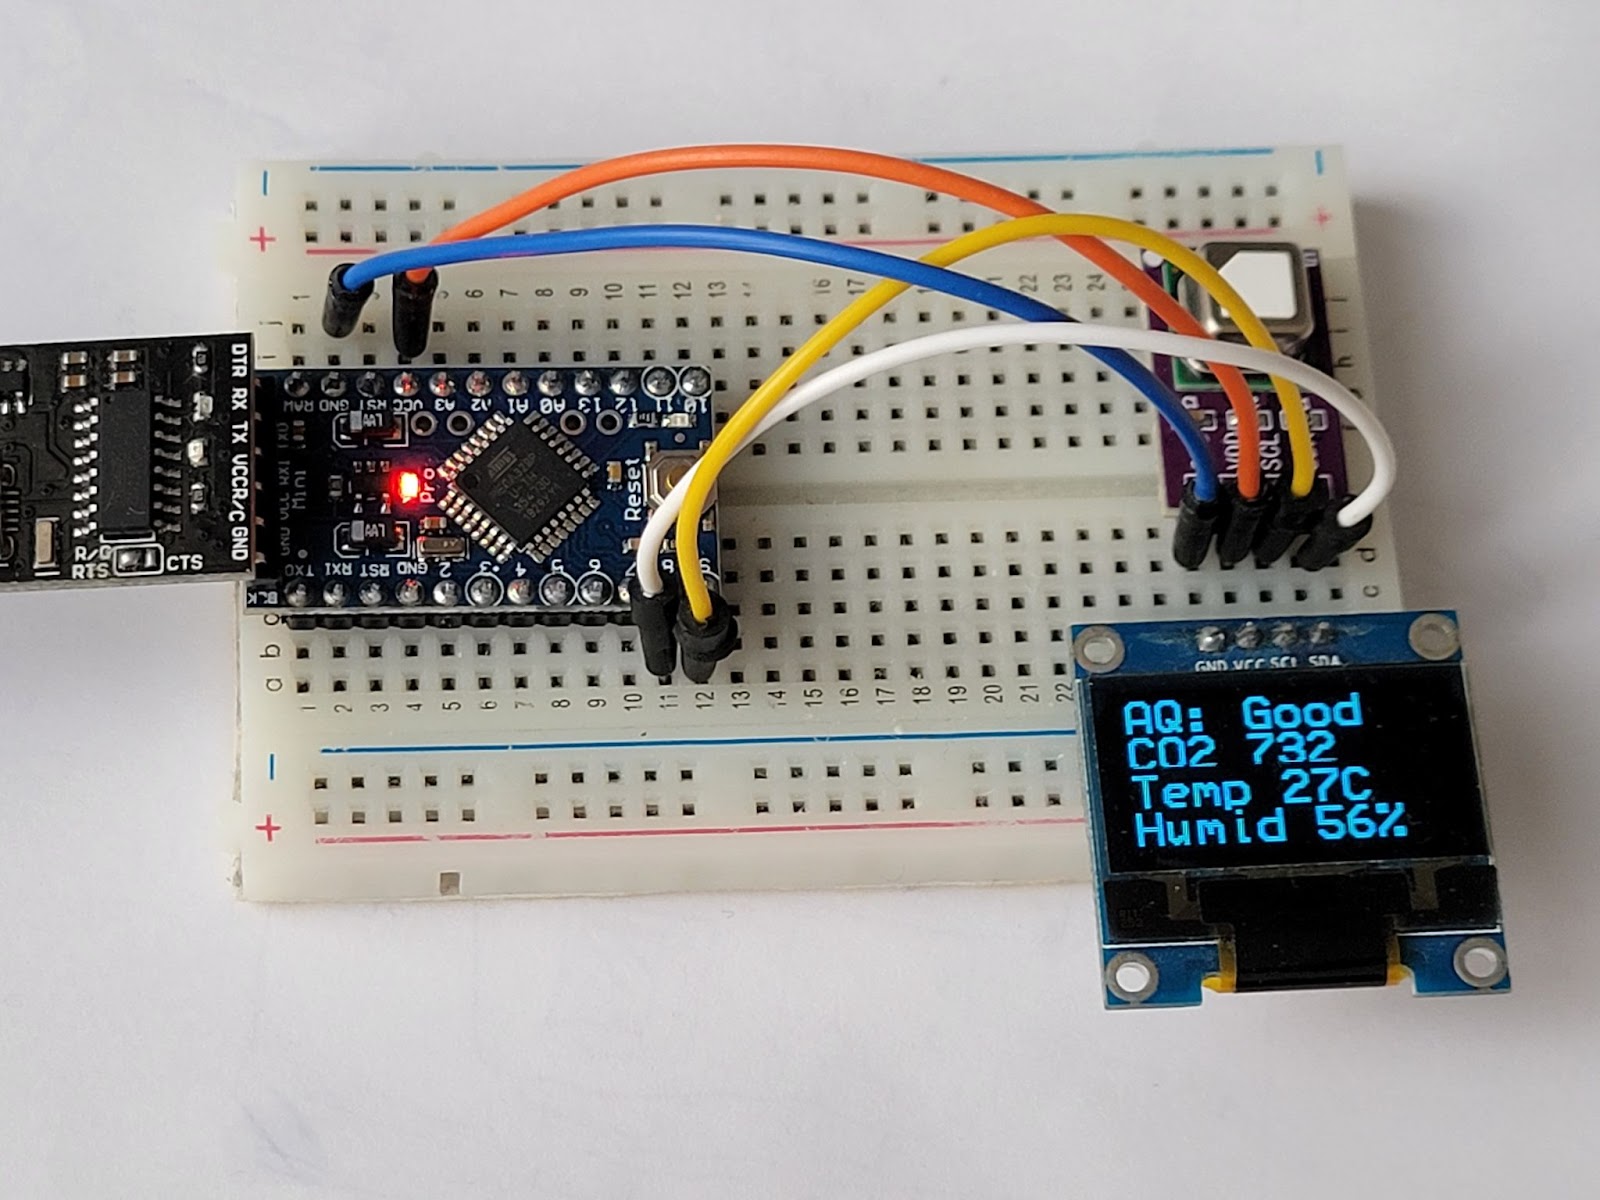
The initial readings looked quite high, but I assumed that the sensor needed time to "settle" or calibrate itself. I left it running overnight and when I woke up, the reported CO2 level was disturbingly high (>3000ppm). I had read a bit about the CO2 concentration values and how they affect your wellbeing, but I still thought there must be something wrong with my setup. On a whim, I held the sensor out an open window and lo and behold, the value settled close to the Earth's current average of around 430ppm. This was quite the eye opener. I had been living with the windows closed for most of my life because the HVAC systems in my various homes were in constant use to maintain the temperature and humidity levels. This is especially true in South Florida during the summer. The air intake for many homes is in an interior hallway, so fresh (outside) air isn't added to the home through the HVAC system. The external air is hot and humid and if you don't keep the A/C running and your windows closed, your house will become covered with mold and mildew. I assumed enough air seeped under the doors and windows to keep the CO2 levels reasonable, but I was quite plainly wrong.
Interpreting the numbers
According to OSHA, these are how CO2 levels affect your health:- 350-1,000 ppm: typical level found in occupied spaces with good air exchange
- 1,000-2,000 ppm: level associated with complaints of drowsiness and poor air
- 2,000-5,000 ppm: level associated with headaches, sleepiness, and stagnant, stale, stuffy air; poor concentration, loss of attention, increased heart rate and slight nausea may also be present.
- >5,000 ppm: This indicates unusual air conditions where high levels of other gases also could be present. Toxicity or oxygen deprivation could occur. This is the permissible exposure limit for daily workplace exposures.
- >40,000 ppm: This level is immediately harmful due to oxygen deprivation.
Going Further
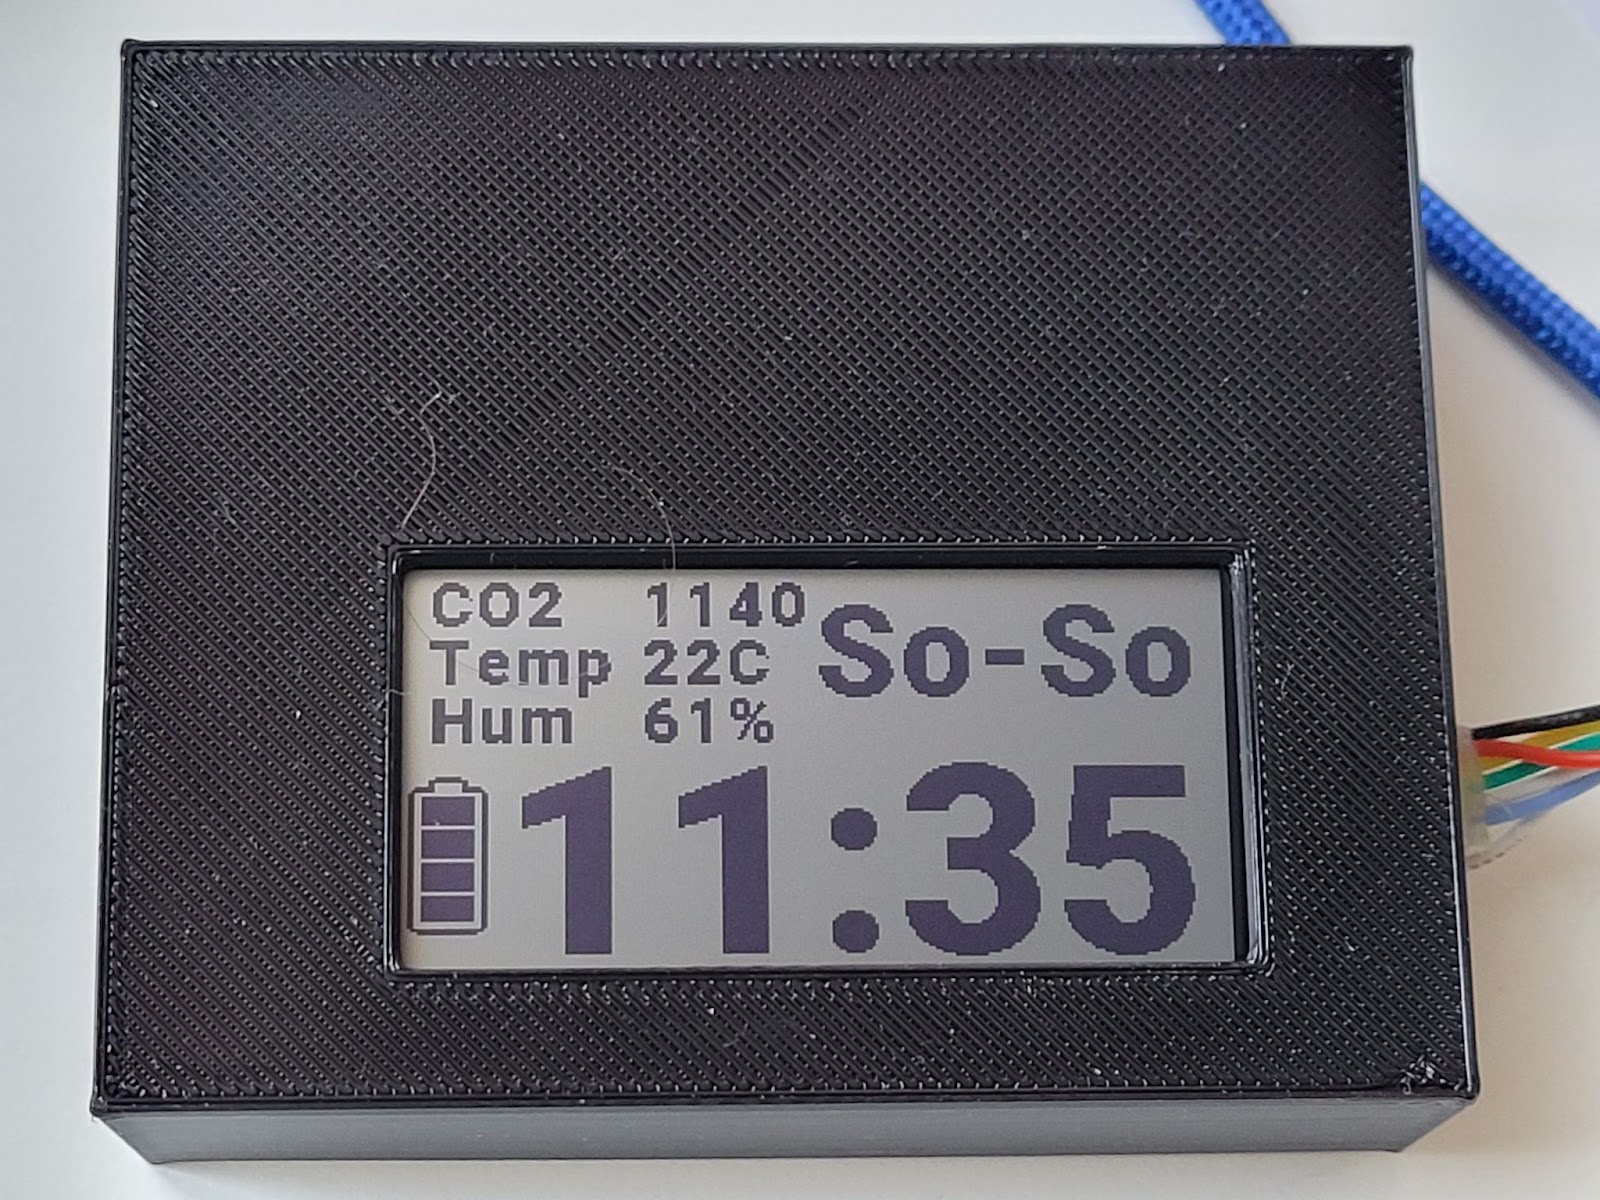
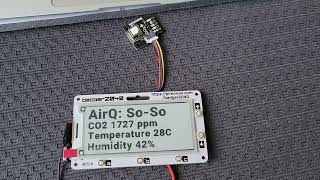
I put together a battery powered rigging to bring the CO2 sensor on the road. I wanted to see what kind of CO2 levels could be found in indoor spaces like shopping malls and restaurants. I had plenty of screen real estate on the ST7302 250x122 low power LCD I chose, so I added a clock to make it more useful while it sits on my desk waiting for its next outdoor adventure.Armed with my bulky "pocket" sensor, I visited various locations - a bakery, a restaurant, a large shopping mall, an apartment converted into a classroom.
- Here's what I found (your findings may differ):
- Large shopping malls, modern offices and public spaces were designed with improved air handling in mind. I saw CO2 values in the 600's (good) even in underground levels.
- Small restaurants / businesses are a mixed bag. A cross breeze can help any retail space, but if all of the doors are closed, be careful!
- Apartments and converted residential spaces generally have very poor air circulation. A few people in a room (even with windows open on one side) will cause the CO2 level to rise quickly into the danger zone. Find a way to create a cross breeze.
Actionable Data
With the CO2 data in hand, my family changed our behavior to improve our indoor air quality. We had all felt occasional sleep disturbances and concentration issues during the day. I wondered if this might be related to the high CO2 levels. We tried the following: In the morning and evening we open our windows to change all of the air and we now keep all of our bedroom doors open at night. During the day we occasionally open the windows on both sides of the apartment to get a cross breeze. In the evening, we check the readings to get them under 600ppm before we sleep and they tend to reach around 1200ppm by the time we wake up. We all seem to feel better lately, so it seems that this change has brought a useful improvement in wellbeing.A very functional fridge magnet
A beautiful piece of kit that looked to me like an excellent way to gather and display CO2 info is the recently released Badger2040 board from Pimoroni. As the name implies, the board was designed to be some kind of badge on a lanyard with a dynamic, yet low power e-ink display.
It includes a RPI Pico MCU on the back, along with a battery connector (no charging circuit) and Qwiic I2C connector. The 3.3v regulator circuit includes a clever idea to save battery power. The RPI Pico has a deep sleep mode, but it still draws close to 1mA when in this mode (compared to a few microamps on other MCUs). To allow the battery to last longer, the team at Pimoroni decided to tie the front buttons and an internal GPIO pin to the EN (enable) pin of the voltage regulator. This means that when off (EN = low), it leaks only about 3uA through the battery circuit. To wake it up, the user has to press one of the front buttons (it wakes up fast enough to read which button was pressed before the user has released it). Once awake, the code needs to set EN to high to keep it powered (by setting the GPIO pin high). When your code is ready to put it back to sleep, simply set EN = low. The down side of this is that no RAM is retained, so to retain any variables for the next power up cycle, they will need to be written to FLASH.
The Parts
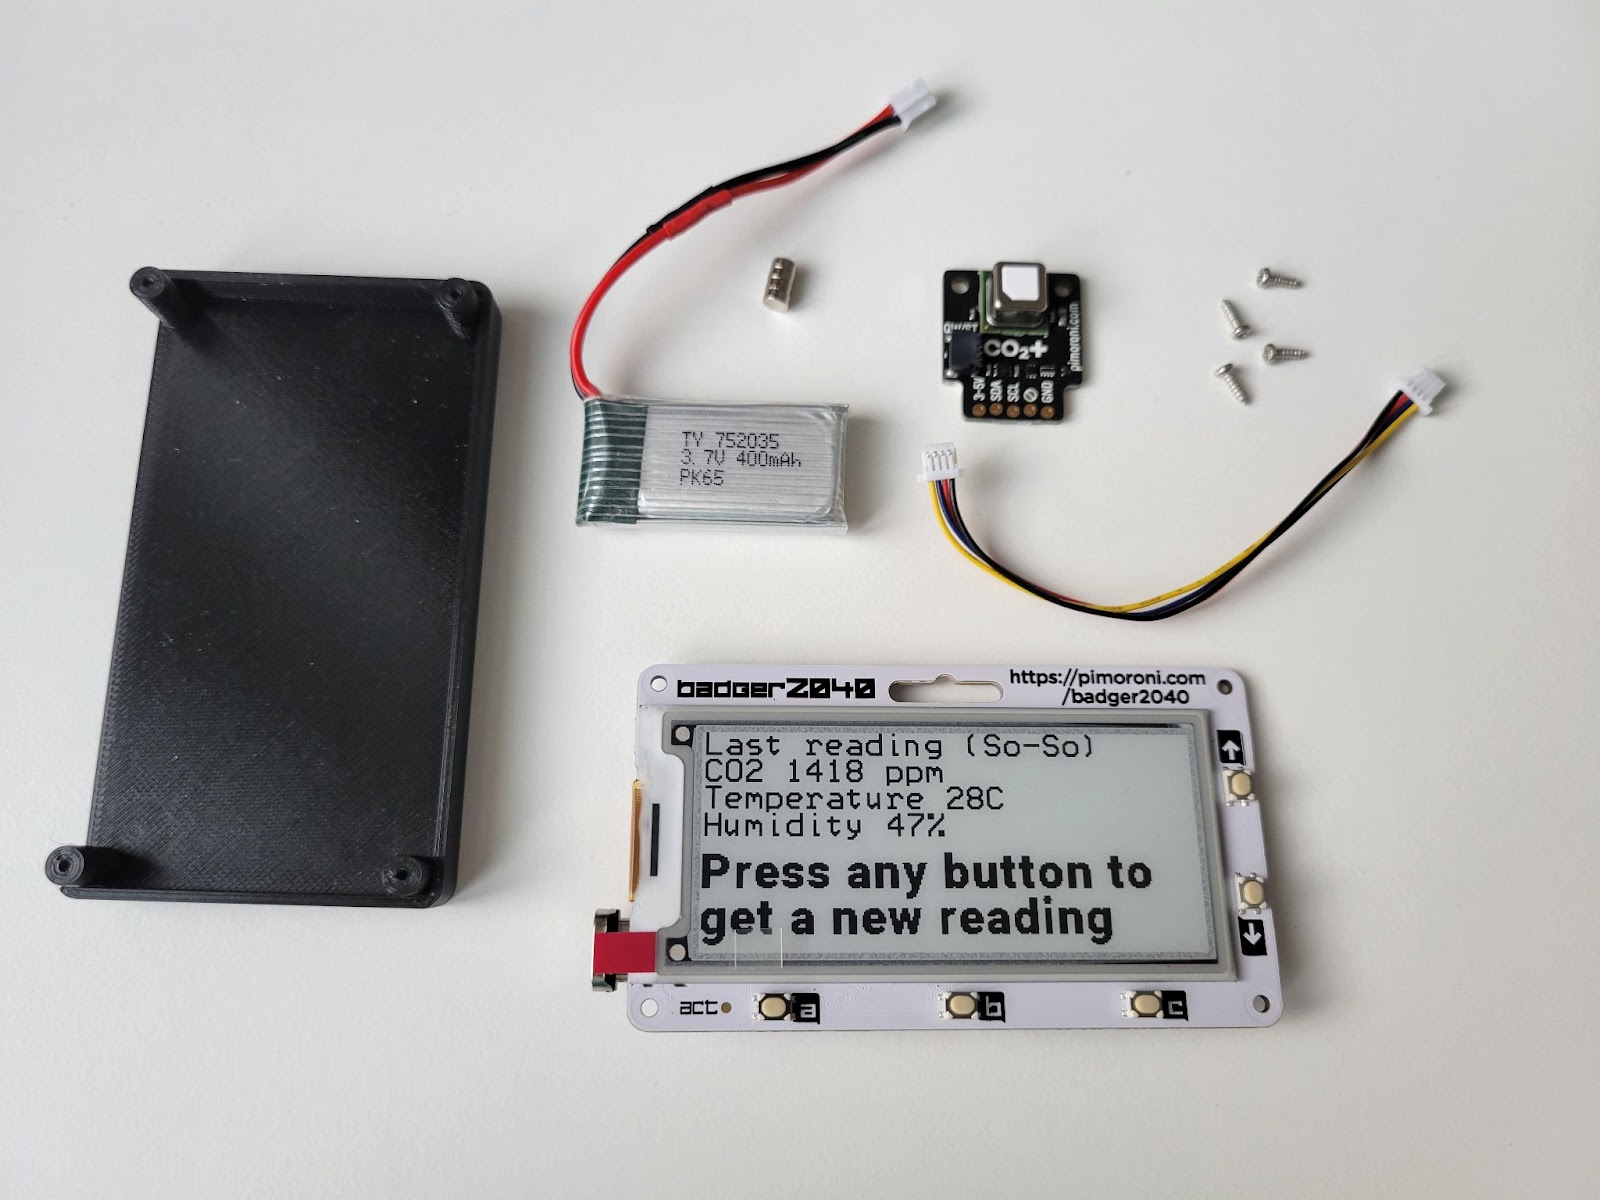
- Pimoroni Badger2040
- Pimoroni SCD41 CO2 sensor
- Qwiic cable
- LiPo battery (I used a different one, but you can use this or a similar one)
- 3D printed case (not required, but helpful)
- 4x2mm Neodymium magnets (not required, but helpful)
- 4 x 1.6x7mm self-tapping screws (I got these in a kit of parts a long time ago)
- Easy to print quickly on any 3D printer
- Holds the battery and SCD41 from dangling from their wires
- Allows air to flow over the sensor
- Has holes for magnets
- Simple design that makes use of the 4 screw holes on the board
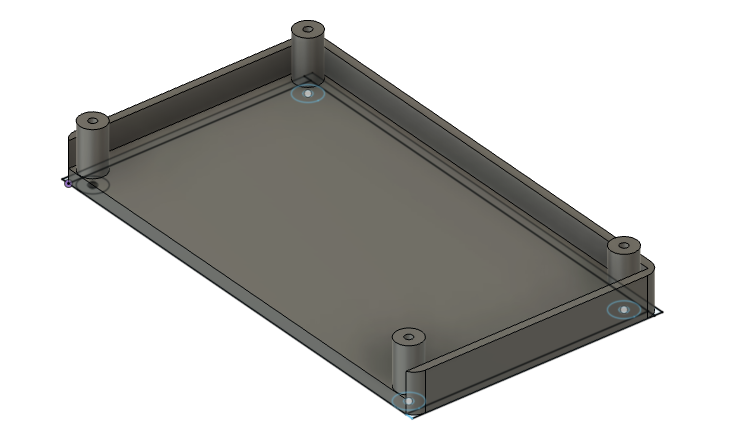
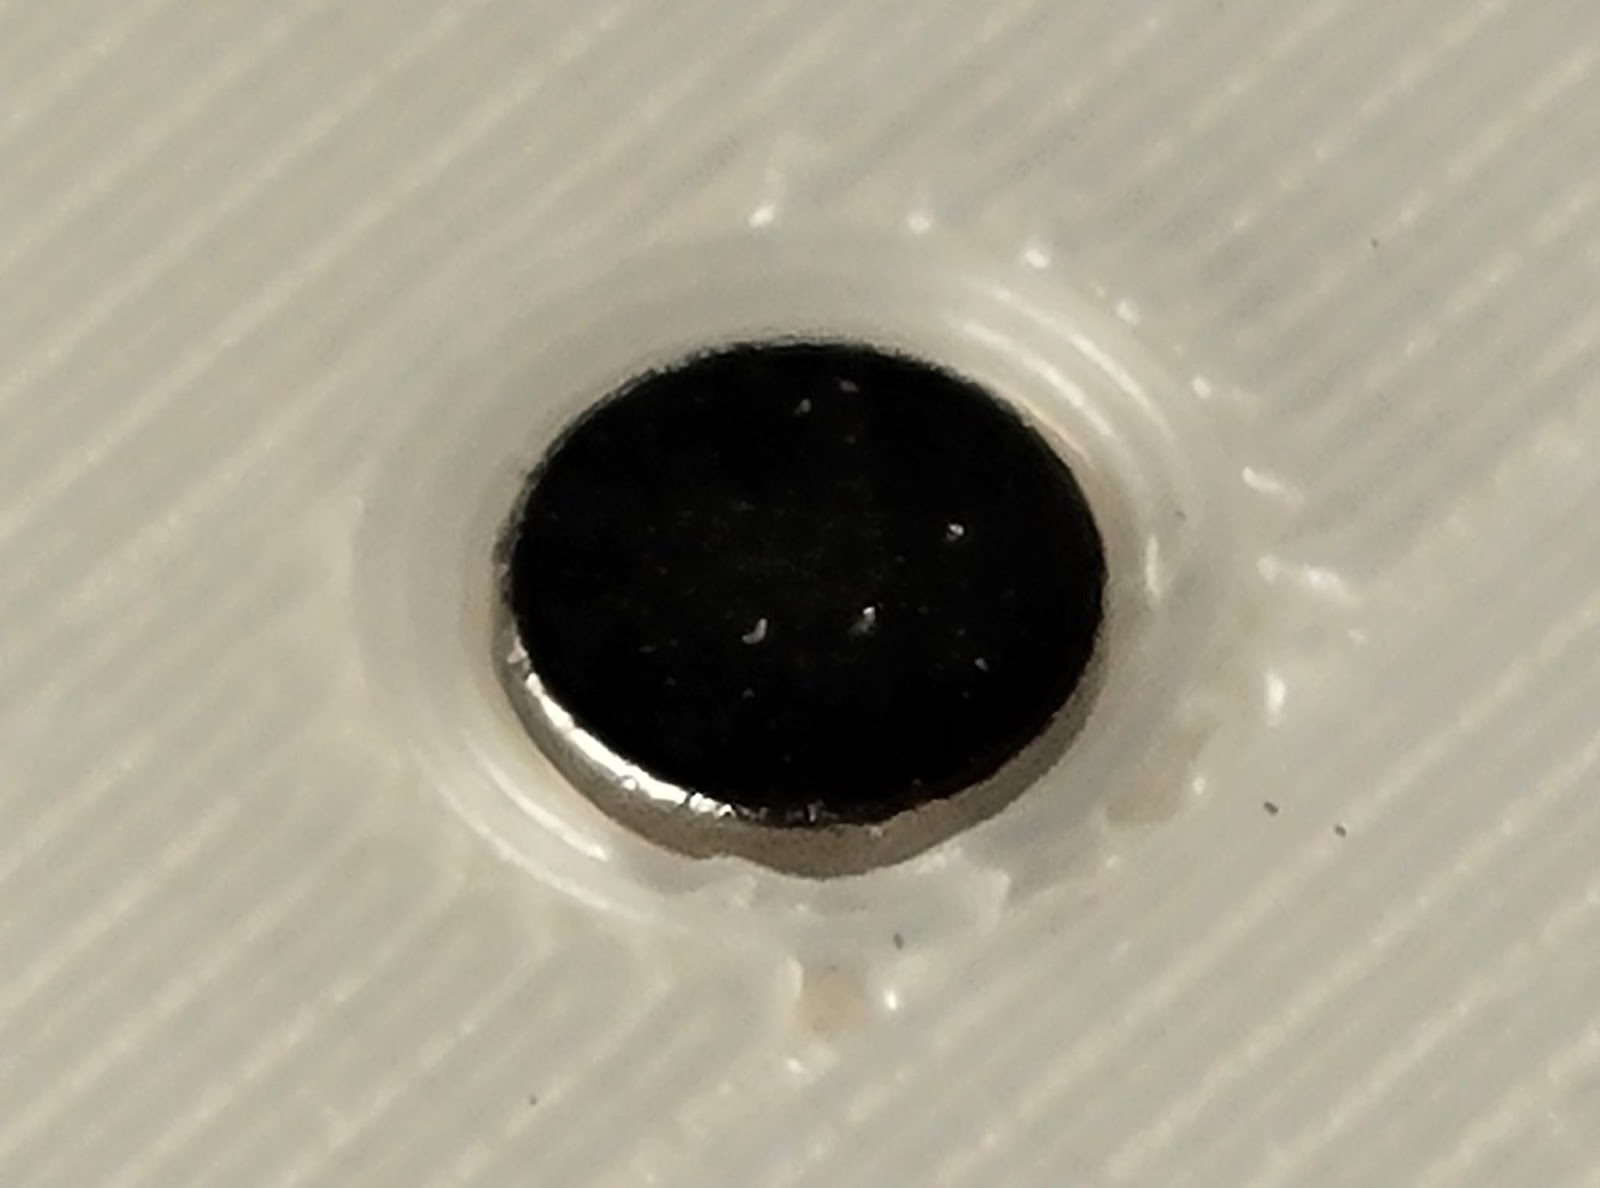
I printed it in PLA and it's plenty strong, yet light. On the bottom I made 4 holes for the 4x2mm neodymium magnets I like to use.
I prefer to use a "press-fit" technique to attach the magnets to the plastic. This type of magnet is easily damaged by heat (even from a glue gun), so I created 4.05mm holes for the 4mm diameter magnets. This extra 1/20th of a mm tolerance accounts for the "squishing" of the PLA as it comes out of the hot end. With this size hole, I can just push them in with a little force against a hard surface. I tested other hole sizes and for this material and diameter, 4.05mm works best. They stay in well enough to not pop out and are flush with the plastic to make good contact with the metal surface you attach it to. They can also be recovered without damage if you want to re-use them. Now that the case is done, we can focus on the software.
The Code
I like to work in native code and also have a tendency to re-invent the wheel a lot. For this project I needed a way to talk to the SCD41 sensor and the 128x296 e-paper display. There are existing libraries for Arduino to talk to both of those devices, but part of my earlier work with the SCD41 necessitated a more flexible driver that could work on Linux as well as on bit-banged GPIO pins, so I wrote my own. Luckily, communicating with the SCD41 was pretty simple. The e-paper display of the Badger2040 was a bit more complicated, but looked like a good challenge for me to add support to my OneBitDisplay library. It uses the UC8151 display controller and just needed a few settings to be customized because of its resolution. With both of those components written, I could then create the sketch used for this project.
The Arduino sketch turned out to be quite simple because all of the heavy lifting is happening in the sensor and display libraries. The e-paper display shows the info provided by the SCD41 in a large, readable font and I added a qualifier phrase to translate the CO2 value into a more human readable form. Based on info from various health sites, I came up with the following scale:
The badge wakes when you press one of the front buttons. It flashes the activity LED to show you that it is awake and then displays 5 consecutive values of the sensor 5 seconds apart (the sensor sets this as the minimum sample time). I use the partial refresh feature of the e-ink controller to update the numbers of the 5 samples without any flashing. Partial refresh can damage the display if not done properly, so before powering down the Badger2040, I do a full refresh with a final reading and instructions for waking it up. You can download the Arduino sketch here. A short video of it in action:
(click to see video)
Final thoughts
This experience has been one of the most practical of my various tech projects. It touches all of the right buttons for me: power optimization, displays, health, useful for the family, and finally, 3D printing. The "CO2 Badger" has been attached to my fridge for several weeks now and is proving quite useful to test the kitchen air quality. The 400mAh LiPo battery looks like it will last for quite a while with a couple of presses per day. Please let me know if you come up with any ideas for improvements.


Hi, this is a great project and I'd like to try it out for my girlfriend, permanently working remote. I believe I miss the Link to the 3D print as it stops me with '404'.
ReplyDeleteFixed
DeleteNice project ! I'm trying to print the case, but i found only one piece (badger2040_case.stl) do you have also the other part that compose it ?
DeleteThere is only a single piece. It connects to the Badger2040 with 4 small screws.
DeleteBrilliant showed data.I thank you that.Most likely it will be expceptionally valuable for my future ventures. Might
ReplyDeleteAny chance you'll end up adding a network back-end to aggregate the data on a webpage for live environment viewing? This is a great project and can't wait for the parts to come back in stock.
ReplyDeleteThis project is meant to be offline only. My other CO2 projects which share data on WiFi use a "headless" ESP32 for the job - https://github.com/bitbank2/ESP_NOW_WEATHER
DeleteHi, I'm using your bb_scd41 library for a similar project. Unfortunately I do not get any decimal places for the temperature readings. Documentation says int 10x (e.g. 25.5 = 255), so that divide by 10 will do the job, but the integer just contains 25. Is this maybe just a glitch in documentation, as there seem to be no decimal places in your images either?
ReplyDeleteIt's definitely returning an integer which represents 10x the temperature in Celsius. Please share your code and continue this via email (bitbank@pobox.com.
DeleteDo you have some example code for the ST7302? I'm struggling to display anything with my ESP32 :-( thanks a lot
ReplyDeleteYes, it's fully supported in my OneBitDisplay library (https://github.com/bitbank2/OneBitDisplay)
DeleteThanks for the reply. I tried your OneBitDisplay library. If I use obdSPIInit(&obd, LCD_ST7302, DC_PIN, CS_PIN, RESET_PIN, MOSI_PIN, CLK_PIN, LED_PIN, FLIP180, INVERT, BITBANG, 0);
DeleteobdFill(&obd, OBD_WHITE, 1);
obdWriteString(&obd,0,0,0,(char *)"Hello!", FONT_16x16, OBD_BLACK, 0);
It only shows white noise. I think I'm missing something in the setup process. It works with another library ... so the connection and ports seem to be right.
This isn't the right place for tech support, but that display needs a full back buffer (~4K RAM) and then after you've drawn something you need to call display(). It's easier to work with it in the C++ API. Take a look at my examples with e-paper or that display to see what I mean.
DeleteCO2 sensors are fun. There are a few different detection variants, but I found the optical scattering sensors to work best in an everyday environment. The best choice in my opinion is MH-Z19. Relatively cheap, widely available, no need for calibration and easy to integrate. However they require quite some time to warm up on the power-up (about a minute) and require a stable power supply. I made a setup that sits on my desk, displays clock and reports CO2 to a MQTT server. Multiple-apartment buildings are notorious for bad air quality without manual air exchange. After moving into a larger house, the need for CO2 meter plummeted due to a substantially larger volume for living and much more trees around, compared to the city.
ReplyDelete